The top 8 React chart libraries
Editor’s note*: This article was last updated on 6 February 2023 to add a number of popular React chart libraries, including Visx and BizCharts.*
Data is everywhere and is an increasingly important part of our lives. We collect, send, and analyze data every day.
Data, in and of itself, is not visually appealing, but we can make it so. Charts make data both aesthetically pleasing and easier to understand and retain because it’s easier to engage with information when there are coordinating visuals to focus on.
When building websites or applications, there are myriad ways to display charts in your work. You may decide to build your charts from scratch or use the many available React chart libraries. In this guide, we’ll compare the top chart libraries for React applications.
Why use React chart libraries?
Chart libraries are designed to ease the process of building charts and other data visualizations. When working on small projects, it’s often simple enough to create charts from scratch. However, if you’re working on a project that requires you to display data of different types, it might be more useful to use a chart library.
In today’s React ecosystem, there are many libraries designed to help you create interactive, responsive, and even animated charts easily and efficiently.
Without further ado, let’s compare the top eight React chart libraries, evaluating each for criteria including features, documentation, community adoption, and customizability. We’ll focus on a few of the most popular and widely adopted React chart libraries.
Recharts

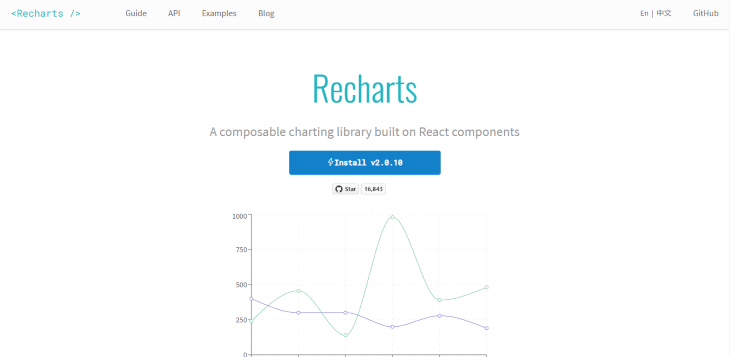
With 19K stars on GitHub, Recharts is a redefined chart library built with D3 and React. One of the most popular charting libraries for React, Recharts has excellent documentation that is easy to understand, as well as great project maintainers.
Recharts follows React’s component principle by enabling users to build charts with its reusable React components. Recharts provides beautiful charts out of the box that can be customized by tweaking the existing component’s props or adding custom ones. It has drawing support for SVGs only and does not provide support for mobile. The charts are not responsive by default but can be made responsive by using a wrapper component.
Recharts has been around for a while, so it has a lot of users and a large community. You can easily get started with this chart library by using its CDN or installing it with either npm or yarn.
React component syntax
Based on D3
SVG support/No Canvas support
GitHub Stars: 19K+
npm downloads: 1.1M+
Backed by Open Source Community